
If you haven’t already, check out the first two posts in this series: It’s easier than you think, lets build a web app
Part two – Figure out the flow
The terms workflow and business process are often used interchangeably, but it’s important to understand the difference between these two terms.
I often discuss processes with founders or their staff, and they describe their workflow back to me.
Most business owners consider their workflow to be a series of steps.
On the other hand, by definition a process is something that takes inputs and produces outputs.
We could therefore logically assume that a workflow – the series of steps used by a business – could be grouped into one or more processes. Herein lies the mastery of BPR (business process re-engineering).
Why is the distinction between a workflow and a process important?
To explore the differences, lets go on a slight tangent and have a look at the sketch below:
Context
Here we have an overarching process, this is known as the context –
Process: To make pasta
Inputs: Ingredients
Outputs: A served meal
Level 1 Processes
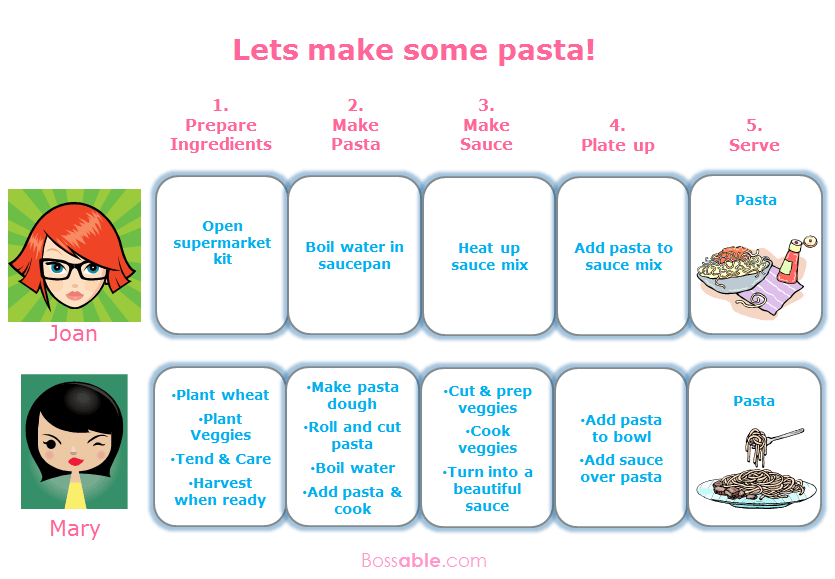
The process (to make pasta) can be decomposed into the following sub-processes:
1. Prepare Ingredients,
2. Make Pasta,
3. Make Sauce,
4. Plate Up,
5. Serve.
We’ll call these our level 1 processes.
Each of these sub-processes have their own inputs and outputs. For example, the output of ‘Make Pasta’, and ‘Make Sauce’ is the input to ‘Plate Up Pasta’.
At this point, we’re only interested in the questions:
- What must be available for the process to start (inputs)? and
- What is expected when the process ends (outputs)?
Can you identify the inputs and outputs for the five level 1 processes?
How do you measure a process?
Lets assume that everyone cooks pasta by following these same five processes.
In the same way that we decomposed our context process into our five level 1 processes; our level 1 processes can be further decomposed into level 2 and level 3 processes and so on. From level 2 onwards, the decomposition becomes more dependent on the person or people who are actually performing the process.
If we look back at the example, Joan and Mary are both following the same level 1 processes (1. Prepare Ingredients, 2. Make Pasta, 3. Make Sauce, 4. Plate Up, 5. Serve). But their level 2 processes (in blue) – the sequence of steps that form their workflows – are completely different.
Because we’ve defined a set of shared processes, this is something that we can now measure.
Measuring Joan’s process
For example, if we associate a time component to Joan’s processes, we may have something like this:
- Prepare Ingredients: 30 seconds,
- Make Pasta: 10 minutes,
- Make Sauce: 2 minutes,
- Plate Up Pasta: 1 minute,
- Serve: 1 minute
We might say that Joan’s process takes 14 minutes and 30 seconds. Or we might say that the ‘Make Pasta’ and ‘Make Sauce’ steps are done in parallel, and therefore, it only takes her 12 minutes and 30 seconds.
Lets do the same for Mary.
Measuring Mary’s process
If we associate a time component to Mary’s processes, we may have something like this:
- Prepare Ingredients: 4 months (assumed time for growing wheat and veggies),
- Cook Pasta: 45 minutes,
- Cook Sauce: 15 minutes,
- Plate Up Pasta: 1 minute,
- Serve: 1 minute
Mary’s process comes in at over 4 months, that’s one long running process!
Recap
By defining processes, we’re able to compare, change, and assess different sequences of steps (workflows), and test them out.
Lets summarise before we move on:
- A process has inputs and outputs
- A process can be measured
- A process may be decomposed into sub-processes
- The steps within one or more processes make up a workflow
- or conversely, a workflow can be grouped into one or more processes
Phew – that’s gotta be some kind of record for the number of times I’ve used the word ‘process’!
Okay, back to our App-Makers web app
To make this more interesting, let’s have a look at demonstrating our business processes as a diagram, to understand what’s going on under the hood at App-Makers.
As you look through these diagrams, think about what types of questions you would need to ask App-Makers to extract out this information:
Data Flow Diagram – Context Diagram
A context diagram is a great place to start exploring. It lets us look at a problem from the outside, and peel away the layers until we get to the core. In the diagram below, we see App-Makers as a bit of a black box (or a pink circle in this case). This is a great way to understand how App-Makers interacts with the entities that live outside of it.
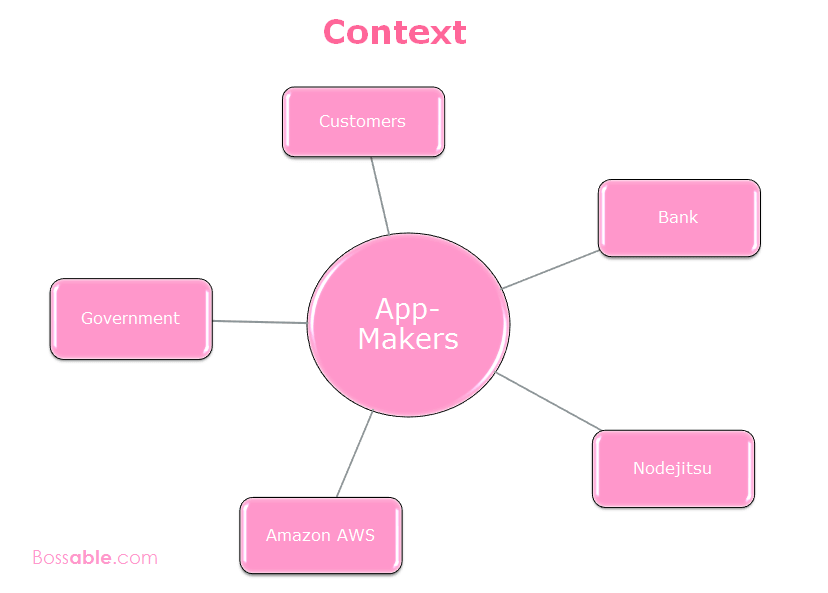
Can you notice the discrepancies in this diagram?
Hint – I’ve been generic with describing the ‘Bank’ entity, but I’ve gotten specific with the hosting providers ‘Amazon AWS’ and ‘Nodejitsu’. Technically, if you follow the rules for data flow diagrams, a diagram should be completely logical, or completely physical.
A data flow diagram or DFD breaks down the context diagram, and comes in two flavours, logical (which focuses on data) and physical (which focuses on things). Can you identify which category the diagram below fits into?
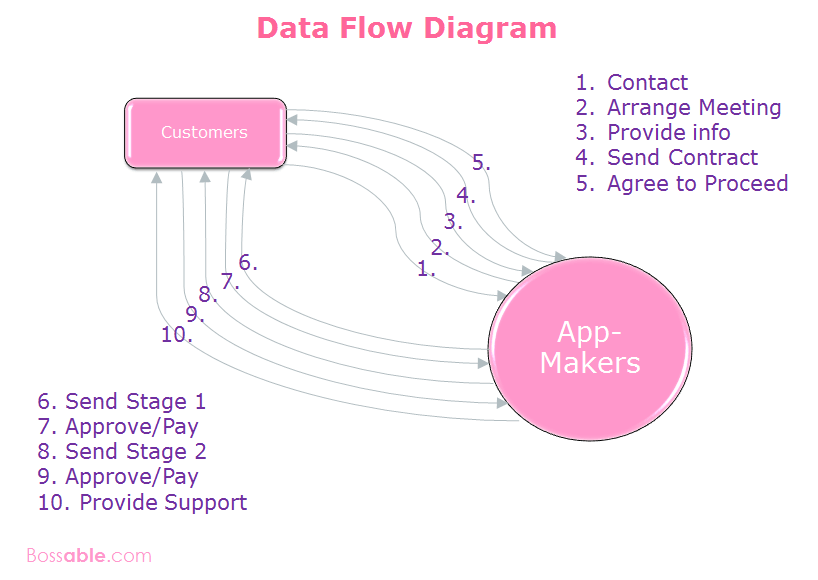
I could continue to decompose the DFD down further, but for the purposes of this post, these diagrams give us a sufficient understanding of the interactions between App-Makers and their customers.
To find out more about DFDs check out the links below, once you understand the rules, you’ll be able to break and adapt them to your situation:
In this post, our goal was to get a better idea of how App-Makers as a company, actually functions. Diagrams, tables, and charts can really help us get into the detail. We’re now able to focus on the processes between App-Makers and their customers in their simplest form. This will help us to focus our questions, and have an educated discussion about App-Makers’ business goals, and their business requirements.
We’ll explore App-Makers’ business goals further in the next post.
Business Goals, Feasibility and Fit Gap – Part 3